Today is the tale of two charts. We knew at the beginning of this decline that this was going to be a steep pullback to shake out the weak hands. The question was not if but when we would start to see the end of the pullback and rally to new highs. In Elliott Wave, we can only be 100% sure what the count is after the dust settles. Therefore many people tend to write of Elliott Wave analysis as counter-productive, but what these same people fail to realize is that as the puzzle pieces of time and price action come together we can start to analyse probabilistic structures in the market. We are coming to the end of the decline but the question is whether this current rally is the first wave up or is there still one more part to drop.
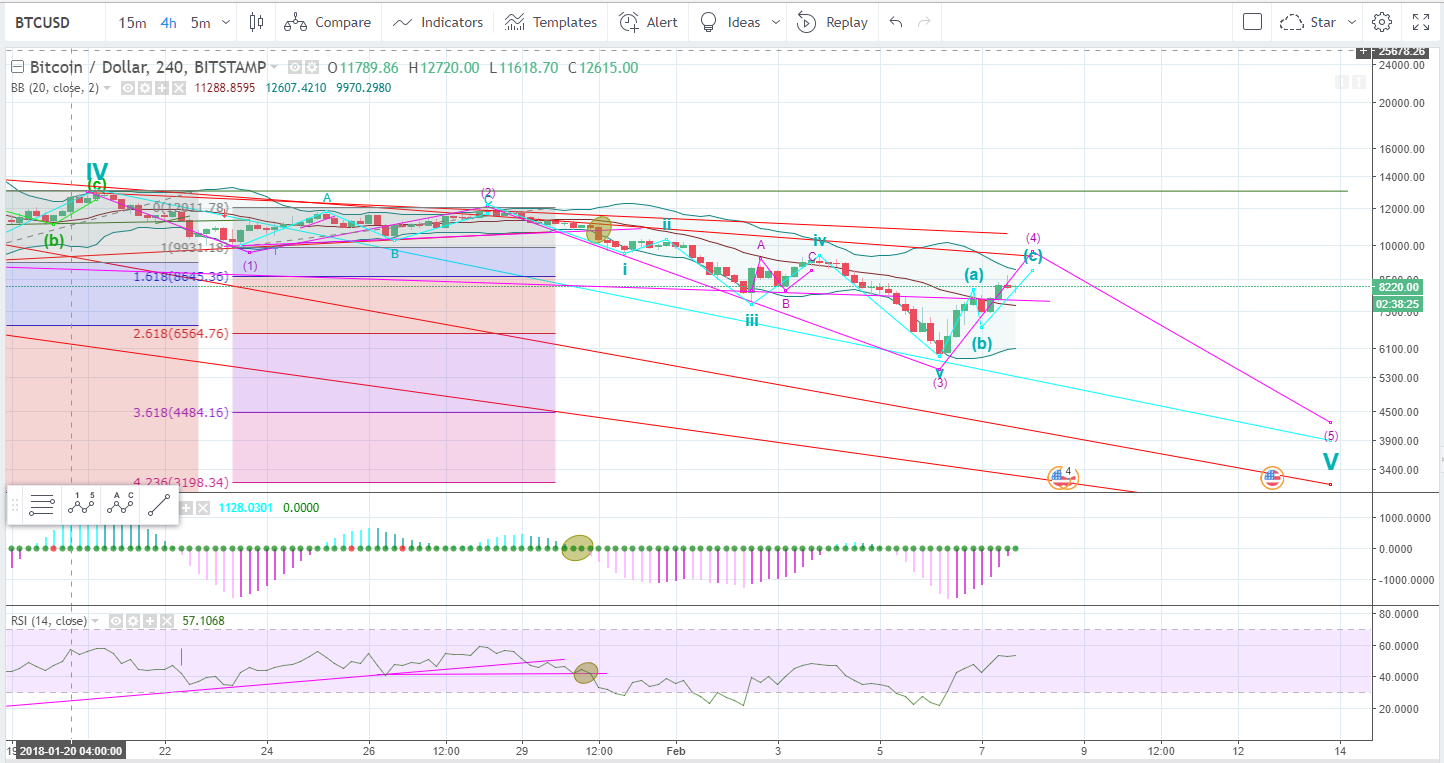
Below is the alternative count that demonstrates the current decline ending with the previous pivot low. It is our conviction that wave iv is to shallow and small to be a suitable pair with Wave i & ii. We could certainly be wrong but we remain bearish that there is the possibility for a new low and that this price rise is the last Wave iv needed for another push into Wave V. Here is the alternative count we are not in favor of but present it as an opposing lens into market price action.
Notice how short and narrow Yellow Wave iii & iv is compared to i & ii. This is our main criticism of this count but it is technically valid from an Elliott Wave rule set.
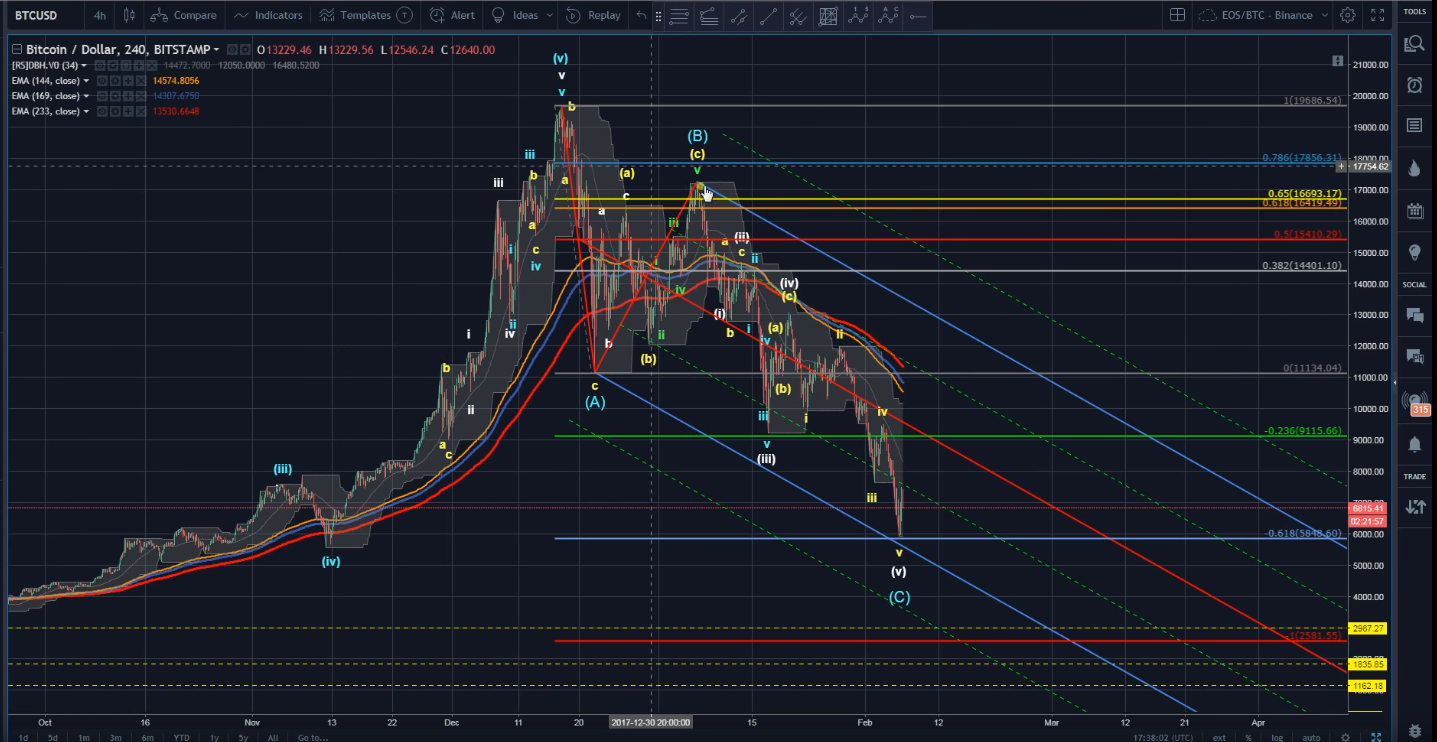
This is our preferred count and we can see that we are likely in the final stages of a Wave C to complete Pink Wave 4. Investors have been buying this rally hand over fist and if/when we see a correction to the downside price action will be very violent and not just panic selling sets in but full on capitulation on BTC gives way to dramatic price swings and buyers throw in the towel.
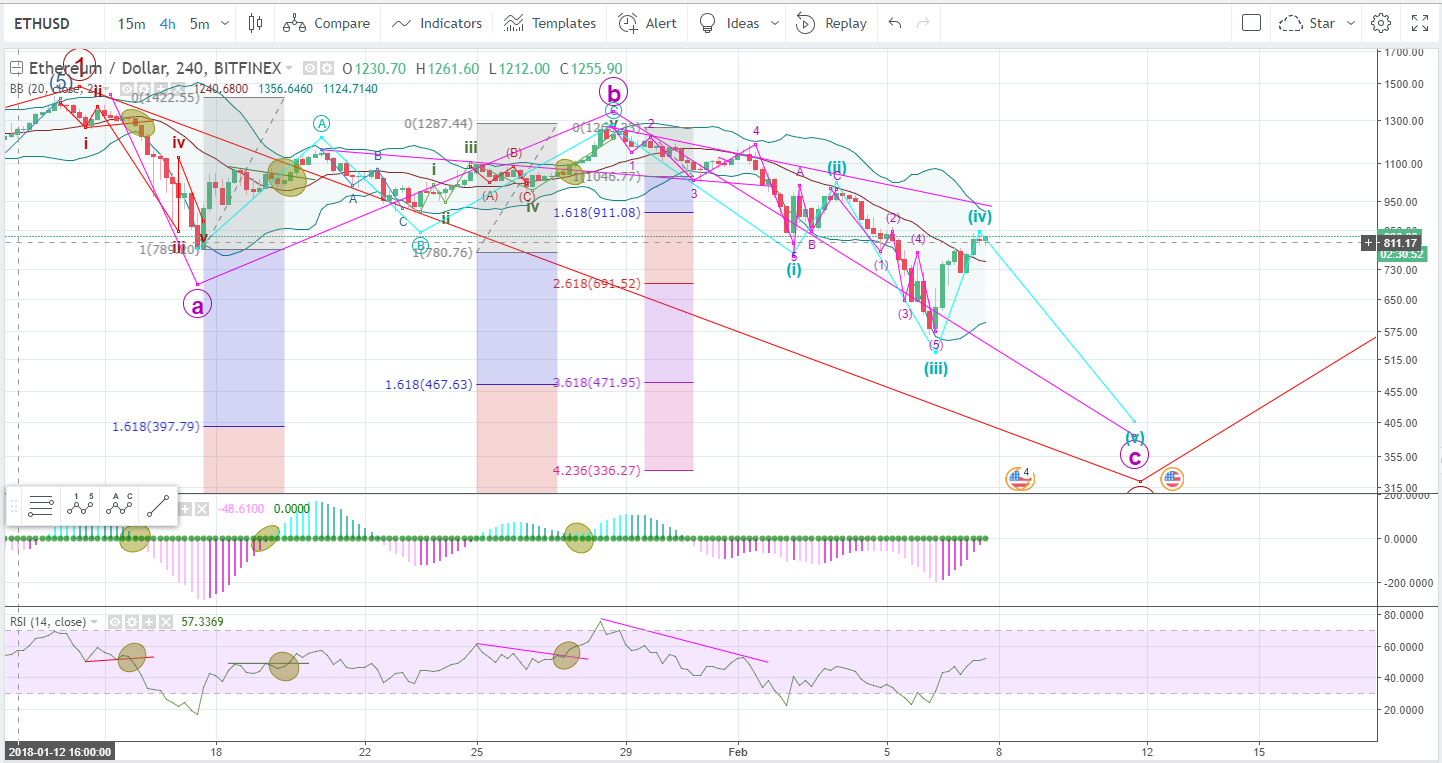
Ethereum has had its Wave count modified to suite the current price action. It could be argued that the Wave count 5 impluse is completed and that would be a persuasive argument if we examined ETH in a bubble. Typically the bounces in ETH have caused BTC rise as a halo effect but for the purposes of this wave count we will look to BTC as the leading indicator with the bias for another decline and therefore adjust the ETH wave count to suit the BTC bearish outlook model.