Trading Education For The Real World
Philosophy of Wealth Growth:
Most people are taught from a early age that wealth is sinful or that to get rich one must look at the structure of wealth as a fixed pie and they must compete with other humans for a static amount of wealth in the world. This principle is erroneous; the basic trajectory of human civilization is on a creative collaboration path in alignment with what some would call God or Universal Consciousness. To get wealthy one must first learn and apply the principle of the book 'The Science of Getting Rich' by Wallace D. Wattles.
https://www.youtube.com/watch?v=YDmghBqWQNo
Platinum Micro-Scalp Trading System:

Step 1: On the 2 Minute chart, create a trendline on the RSI with multiple tests of support/resistance then wait for a break of the trendline (Displayed on the lowest portion of the chart)
Step 2: Watch for the TTM Squeeze to turn over in the direction of the RSI trendline break. (Displayed on second indicator from the bottom)
Step 3: Use the 55 Exponential Moving Average [EMA] (displayed in the Red line on the top of the chart) along with the 34 and 21 EMA to confirm the trend. Only trade once the price action has crossed the 55 EMA in the direction of the RSI trendline break and the TTM Squeeze crossover.
Notes:
Use the 55 EMA as the hard stop loss. Once price action crosses over the 55 EMA stop out of the trade and cut the trade loose.
Use the 21 EMA (Pink line) as the first profit target. Take 1/2 the position off at the first cross over the 21 EMA.
Optional- Use the Darvis Box indicator arrows to provide a signal and entry point above/below the signal candle.
Optional - Use Parallel Trendlines on price chart to signal candles trading within a range and the breakout of the range signals the trend change.
Platinum Trading System:

4 Hour charts with the combination of RSI, and TTM_Squeeze can serve as an optimal signal opportunity to trade in the range of 4-30 day trade duration.
Step 1: Look for an obvious ABC correction pattern after a uptrend in price movement (can also be used for bearish calls to the downside).
Step 2: Wait for some type of smaller 5 wave move higher off of the ABC pattern.
Step 3: Watch for the TTM Squeeze to setup another price rise after the Wave 2 decline (shown in Pink). The TTM Squeeze histogram will start to cross over the zero line.
Step 4: Create a trendline break above the peaks of the RSI where the 1&2 of the first wave (pink) overlap with the waves of 1&2 of the second wave structure (blue).
Step 5: Enter the trade on the break of the RSI and the break of the trendline on the Price chart.
Step 6: Create a Fibonacci Extension stretching from greater wave 1 to 0 (pink).
Step 7: Sell 1/2 the position at the 1.618 extension. With a remaining Stop Loss at break even in case the trade turns around against the trend.
Step 8: Sell other 1/2 of the position at 2.618 extension. Wave 3 &4 can usually be choppy but will usually give another set of entries for a 5th wave higher. So rinse and repeat for Wave 5 (pink).
*Notes*:
Position size should be no more than 10% of account balance for any one trade. It is NEVER recommended to allocate all trading capital for one trade.
If a trade entry is missed, do not chase the trade, there will always be more trades.
Producing consistent results is like following a cooking recipe, do NOT improvise. Just because you want sweeter cookies does not mean if you dump an extra 2 cups of sugar you will get better tasting cookies.
Platinum Scalp System:
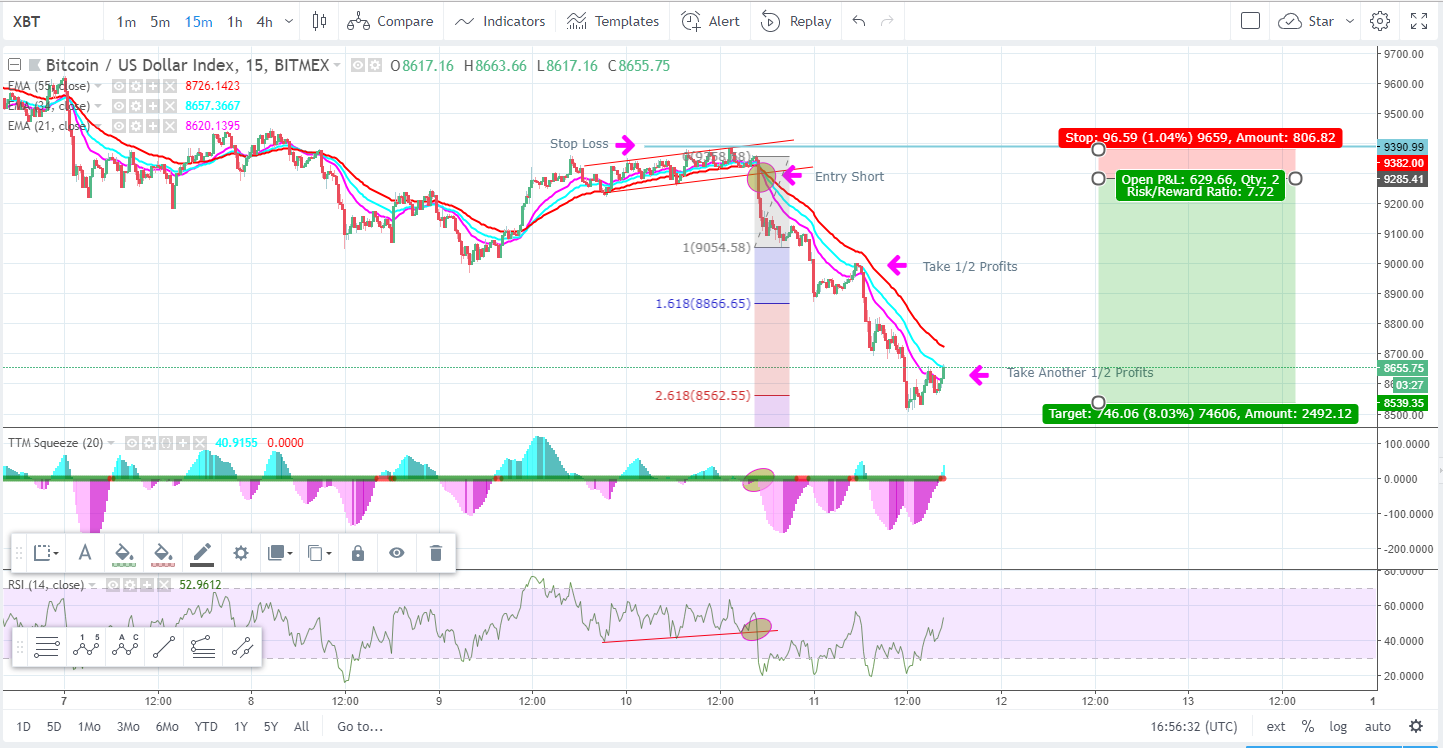
15 minute charts with the combination of RSI, and TTM_Squeeze can serve as an optimal signal opportunity to trade in the range of 5 minutes-4 hour trade duration.
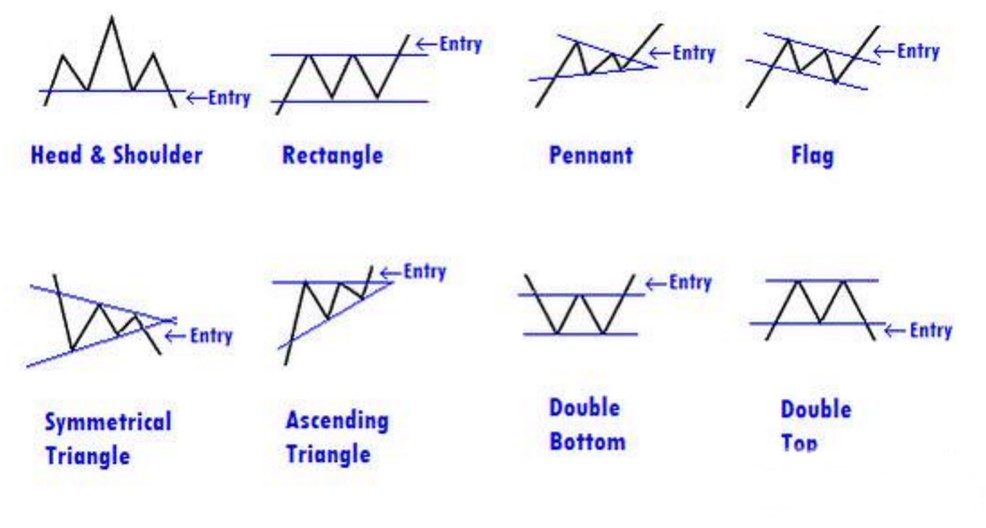
Step 1: Look for a 'Parallel Channel', 'Rising Wedge'or 'Ascending Triangle' pattern on the charts.
Step 2: Wait for the TTM_Squeeze Historgram to turn over in the trade direction of the 55, 34 and 21 Exponential Moving Averages (EMAs).
Step 3: Create an upper or lower breakout trendline on the RSI and Price Candlesticks.
Step 4: Enter on the breakout, with a Stop Loss on the pivot low of the last MAJOR wave.
Step 5: Sell 1st 1/2 of the position at Target Price @ 1.618 Fibonacci Extension or first touch of the 34 EMA. Move Stop Loss to break even price.
Step 6: Sell 2nd 1/2 of the position at Target Price @ 2.618 Fibonacci Extension or second touch of the 34 EMA.
*Notes*:
Position size should be no more than 10% of account balance for any one trade. It is NEVER recommended to allocate all trading capital for one trade.
If a trade entry is missed, do not chase the trade, there will always be more trades.
RSI Alligator Entry Signal Code For TradingView:

Best used with the 30min chart for main entry and 2min chart for micro entry
//@version=4
strategy("StarHaze 4Set RSI Alligator", overlay=false)
jaws = rsi(close, 34)
teeth = rsi(close, 5)
lips = rsi(close, 13)
plot(jaws, color=color.blue, title="Jaw")
plot(teeth, color=color.green, title="Teeth")
plot(lips, color=color.red, title="Lips")
message_long_entry = input("long entry message")
message_long_exit = input("long exit message")
message_short_entry = input("short entry message")
message_short_exit = input("short exit message")
longCondition = crossover(rsi(close, 13), rsi(close, 34)) and (rsi(close, 5) > rsi(close, 34))
longCondition2 = crossover(rsi(close, 5), rsi(close, 34)) and (rsi(close, 13) > rsi(close, 34))
longConditionClose = crossunder(rsi(close, 13), rsi(close, 34)) and (rsi(close, 5) < rsi(close, 34))
longConditionClose2 = crossunder(rsi(close, 5), rsi(close, 34)) and (rsi(close, 13) < rsi(close, 34))
if longCondition
strategy.entry("long", strategy.long, alert_message = message_long_entry)
if longCondition2
strategy.entry("long", strategy.long, alert_message = message_long_entry)
if longConditionClose
strategy.close("long", strategy.long, alert_message = message_long_exit)
if longConditionClose2
strategy.close("long", strategy.long, alert_message = message_long_exit)
shortCondition = crossunder(rsi(close, 13), rsi(close, 34)) and (rsi(close, 5) < rsi(close, 34))
shortCondition2 = crossunder(rsi(close, 5), rsi(close, 34)) and (rsi(close, 13) < rsi(close, 34))
shortConditionClose = crossover(rsi(close, 5), rsi(close, 34)) and (rsi(close, 13) > rsi(close, 34))
shortConditionClose2 = crossover(rsi(close, 13), rsi(close, 34)) and (rsi(close, 5) > rsi(close, 34))
if shortCondition
strategy.entry("Short", strategy.short, alert_message = message_short_entry)
if shortCondition2
strategy.entry("Short", strategy.short, alert_message = message_short_entry)
if shortConditionClose
strategy.close("Short", strategy.short, alert_message = message_short_exit)
if shortConditionClose2
strategy.close("Short", strategy.short, alert_message = message_short_exit)
// === BACKTESTING: EXIT strategy ===
sl_inp = input(10, title='Stop Loss %', type=input.float) / 100
tp_inp = input(90, title='Take Profit %', type=input.float) / 100
stop_level = strategy.position_avg_price * (1 - sl_inp)
take_level = strategy.position_avg_price * (1 + tp_inp)
strategy.exit("Stop Loss/Profit", "Long", stop=stop_level, limit=take_level)
Chart Patterns:
RSI Divergence:

Ichimoku Cloud:

Ichimoku Cloud is referred to as to as the "one glance cloud" chart and offers an easy glimpse of the overall trend of a chart. The cloud (indicated by the Senkou A/B) will offer general support or resistance of the trend. The tenkan Sen and Kijun Sen crossover can signal trade entries in the direction of the cloud trend.
Elliott Wave Principle:

Elliott Wave at its foundation is deceptively simple but the level of expertise required to trade effectively is incredibly high. It is by far one of the most important aspects of trading the learn but takes years to master. At its core there are 5 waves up in an impulsive motive wave and 3 corrective waves.
https://www.investopedia.com/articles/technical/111401.asp
Fibonacci Analysis:


Fibonacci Analysis is used for projections in the future of what potential support or resistance might be for the chart. For a market in decline potential support lines would converge at the 78.%, 61.8%, 50%, and 38.2% retracement lines. For a chart rising the potential resistance lines would occur at 1.27%, 1.618%, 2.382%, or 2.618% extension lines.
Chart Basics:
Introduction To Cryptocurrencies:
Elliott Wave Principle Explained:
General Tips To Be In The Top 10%:
Understanding Stock Options: