Bitcoin's head fake to the upside did throw off the current count but makes sense when looking at the new price action. The last suspected Primary Wave 2 decline was quite short and not long enough to propel us into a multi-week decline. Although BTC did catch some breaks to the downside, yesterdays choppy sideways action showed a lot of buyers willing to step in at these price ranges.
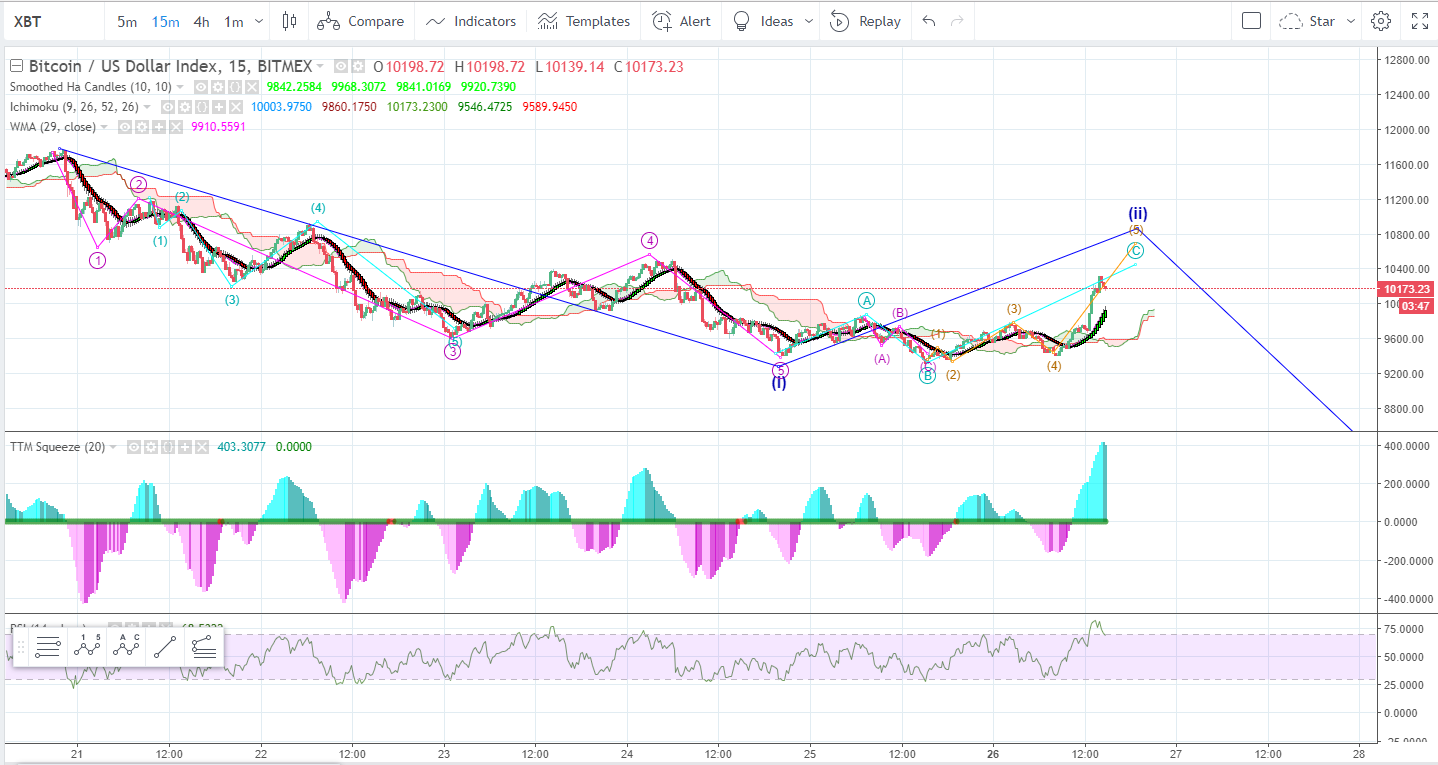
This would be a closer 15min chart of the price action. Here we label last nights action as part of a C wave move higher to complete Wave II. We also want to be prepared for this being the start of a 3rd Wave Impulse move higher if those Bullish counts start to play out.
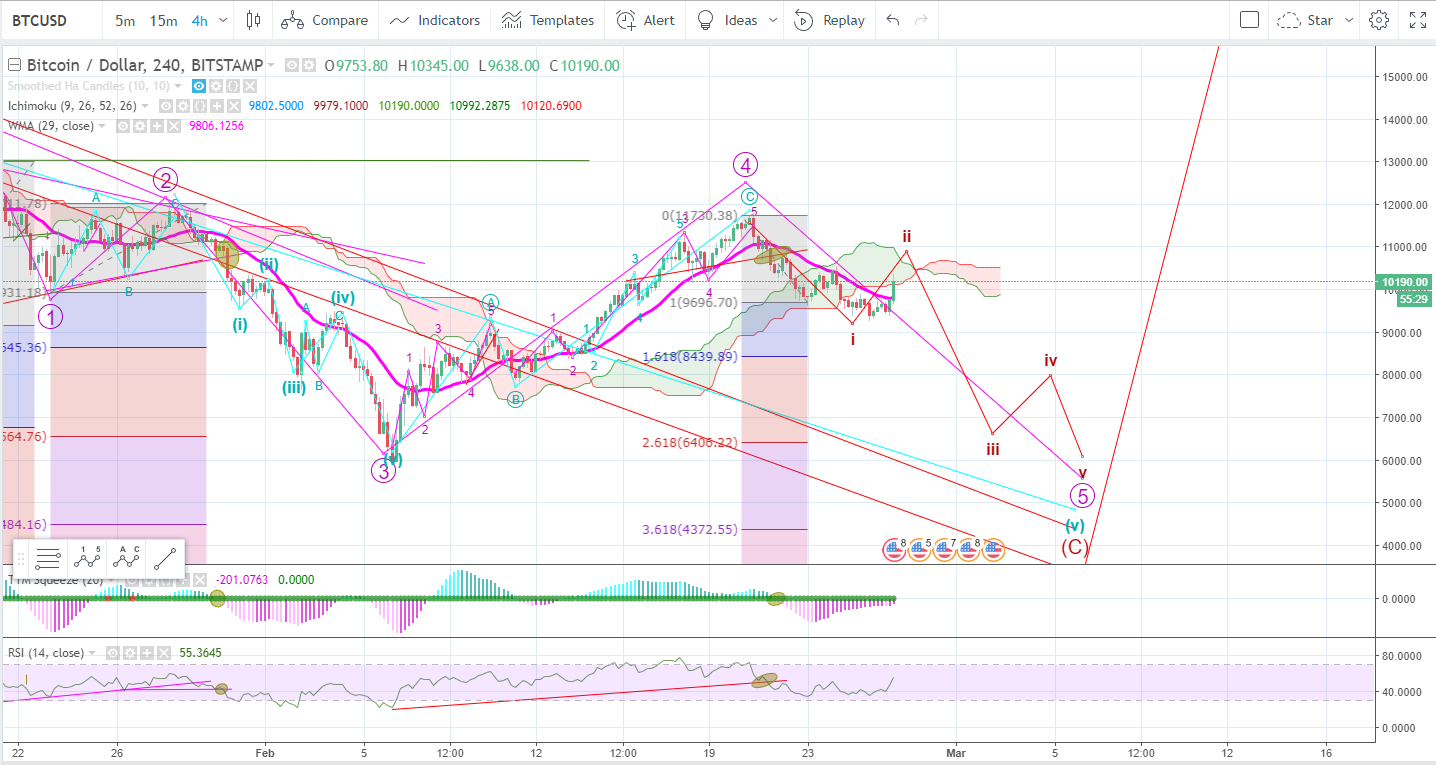
On the 4Hr Chart we can see that price action is finding resistance as it pierces the Ichimoku Cloud. Since we already broke the cloud structure to the downside, the bias is Bearish until we can see price action break above the Ichimoku Cloud.
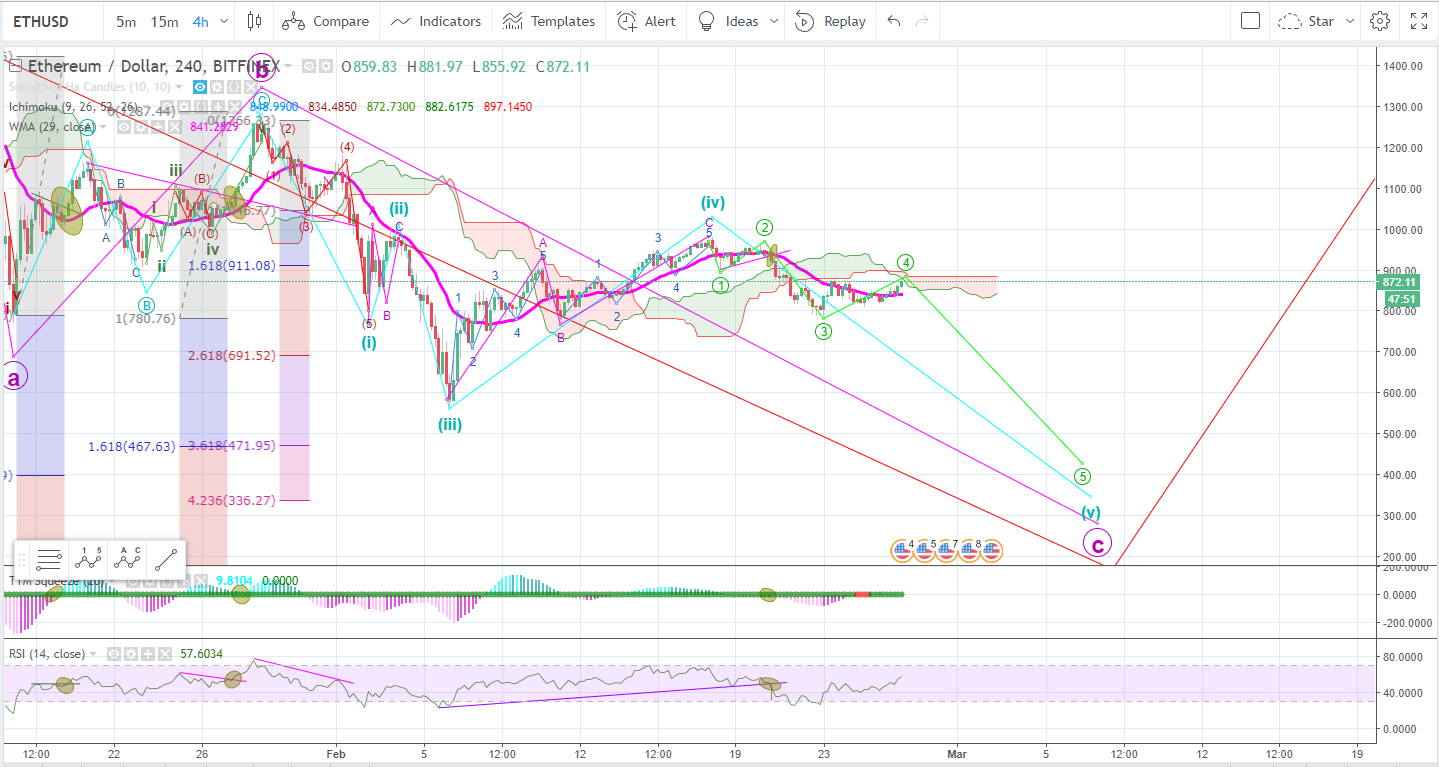
Ethereum we counted as having a long 5th wave move. It is interesting how different ETH looks when compared to BTC. In this scenario, if Bitcoin did start to get a sell off then we would see ETH absolutely crushed with very little impulse waves, smaller than currently counted.
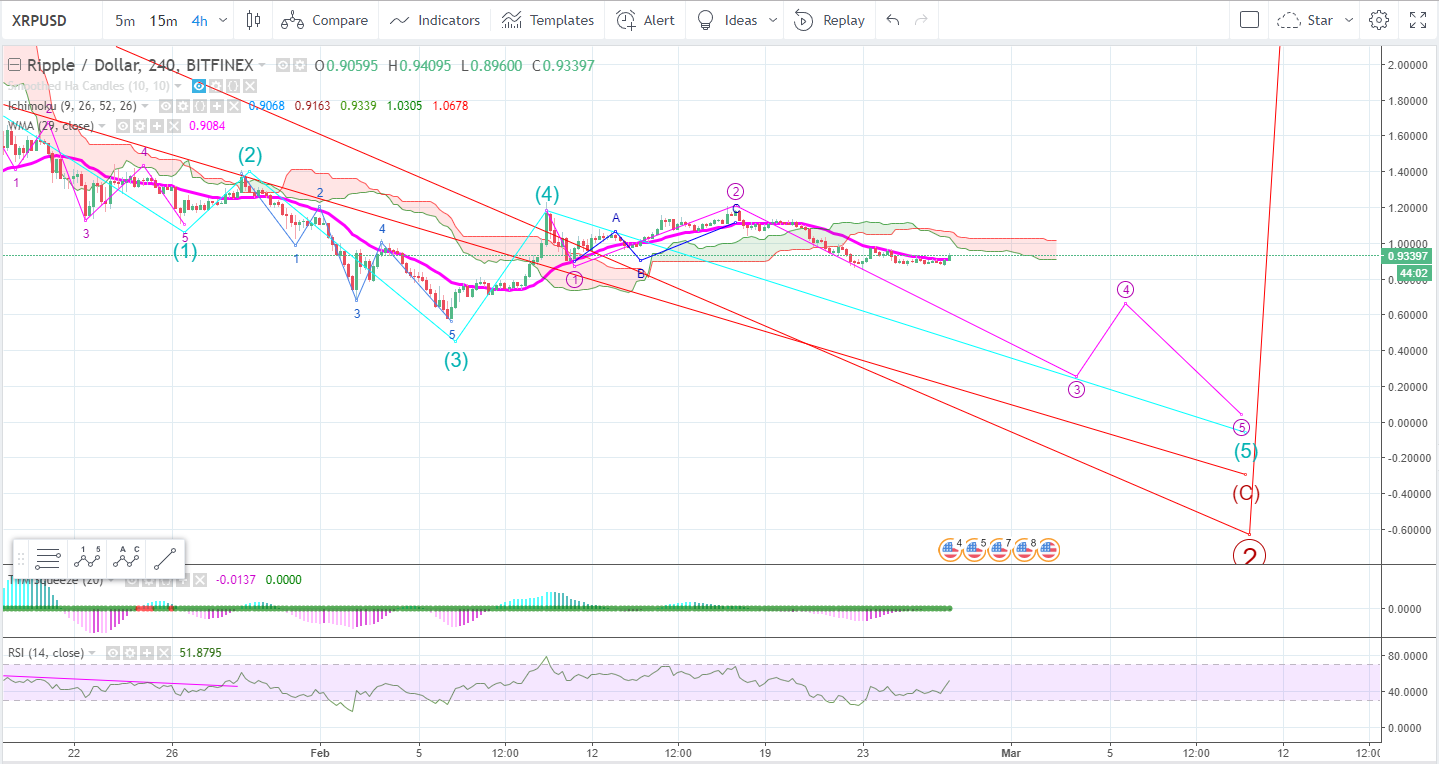
While BTC is shooting for the moon, XRP has barely an uptick. This is still a red flag that this does not look like a rally off the lows to new highs. Ripple despite all its flaws has huge potential in the banking sector and there is barely any movement in XRP.