Not much has pushed the narrative for Bitcoin in either direction and we arrive at an impasse. Below are two constructed Bitcoin charts with divergent wave counts. Any further rise will invalidate the Bearish Wave count. Meanwhile Ethereum is looks to be hitting a 'Buy Trigger'.
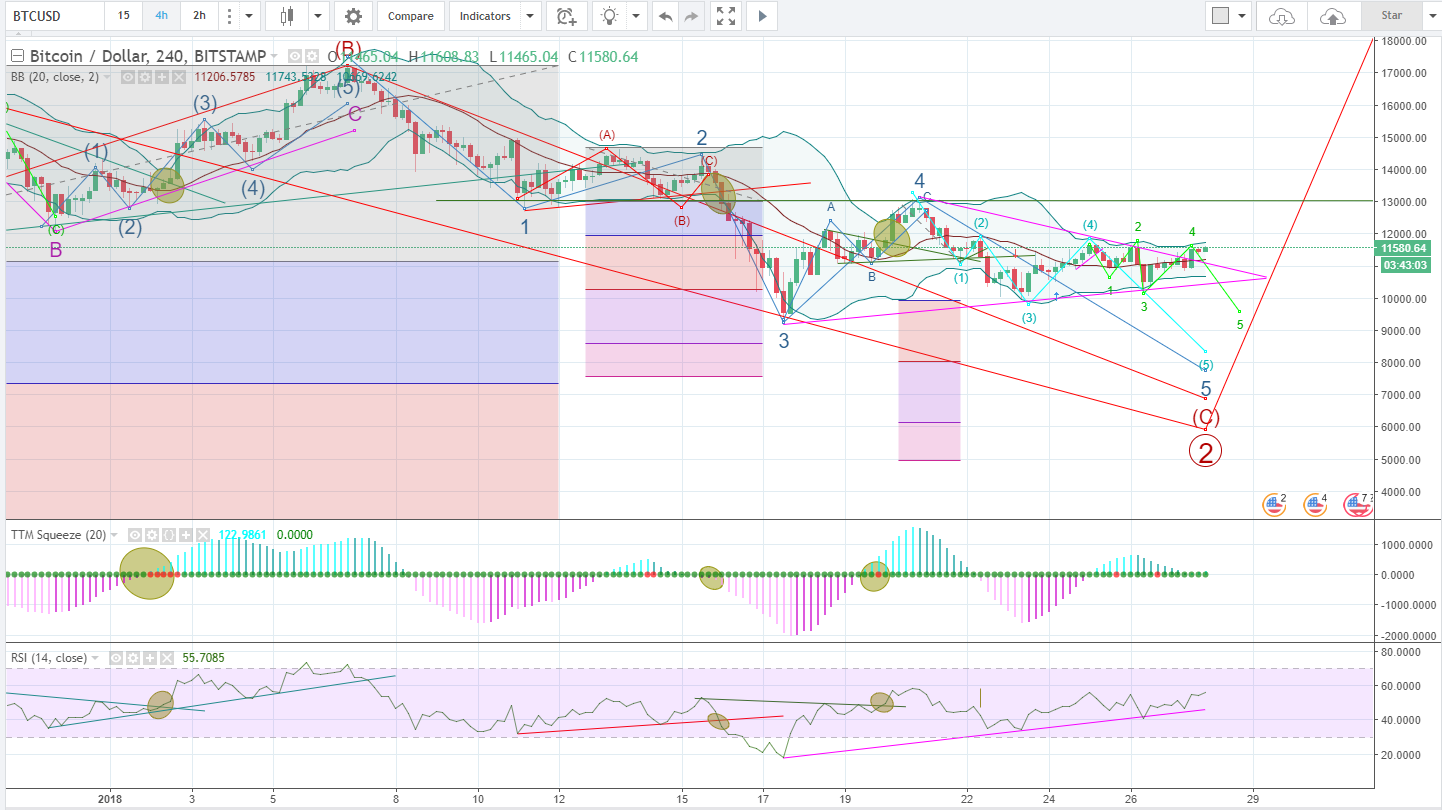
The last green Wave 4 is about to be invalidated by surpassing green wave 2's end point. This leads us to question if it is instead a bullish chart.
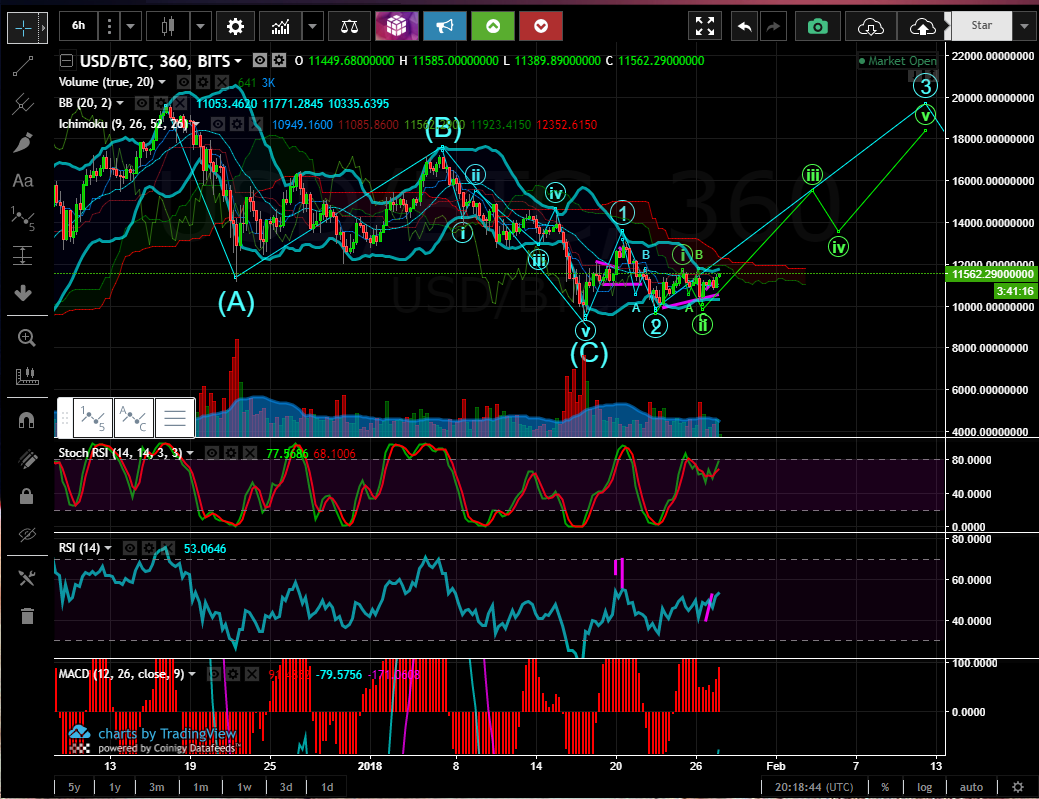
This would be the bullish case for BTC going forward. Noting that it completed the ABC pattern and has turned up in to 5 impulse waves. Still too early to tell but if BTC does start to break out here it might be a good idea to start offloading USDT (Tether) and converting some back into BTC.
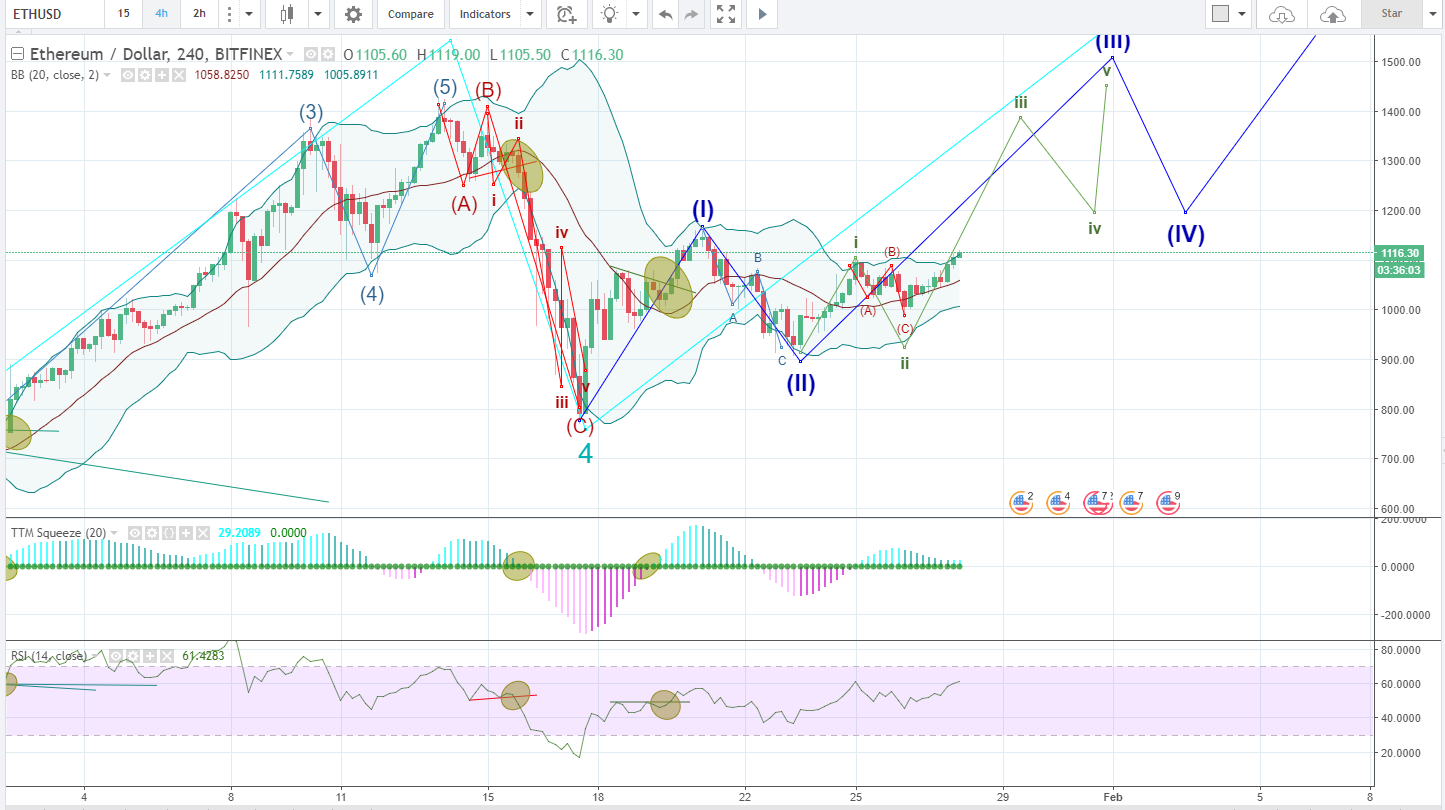
Looking at Ethereum here we can see that it is breaking above Green Wave i. This could be a Bullish breakout and one could argue that it has set a 'Buy Trigger', although I wanted to give it more time before I marked it on the chart. Stop Loss would be below $1k.